 Signin


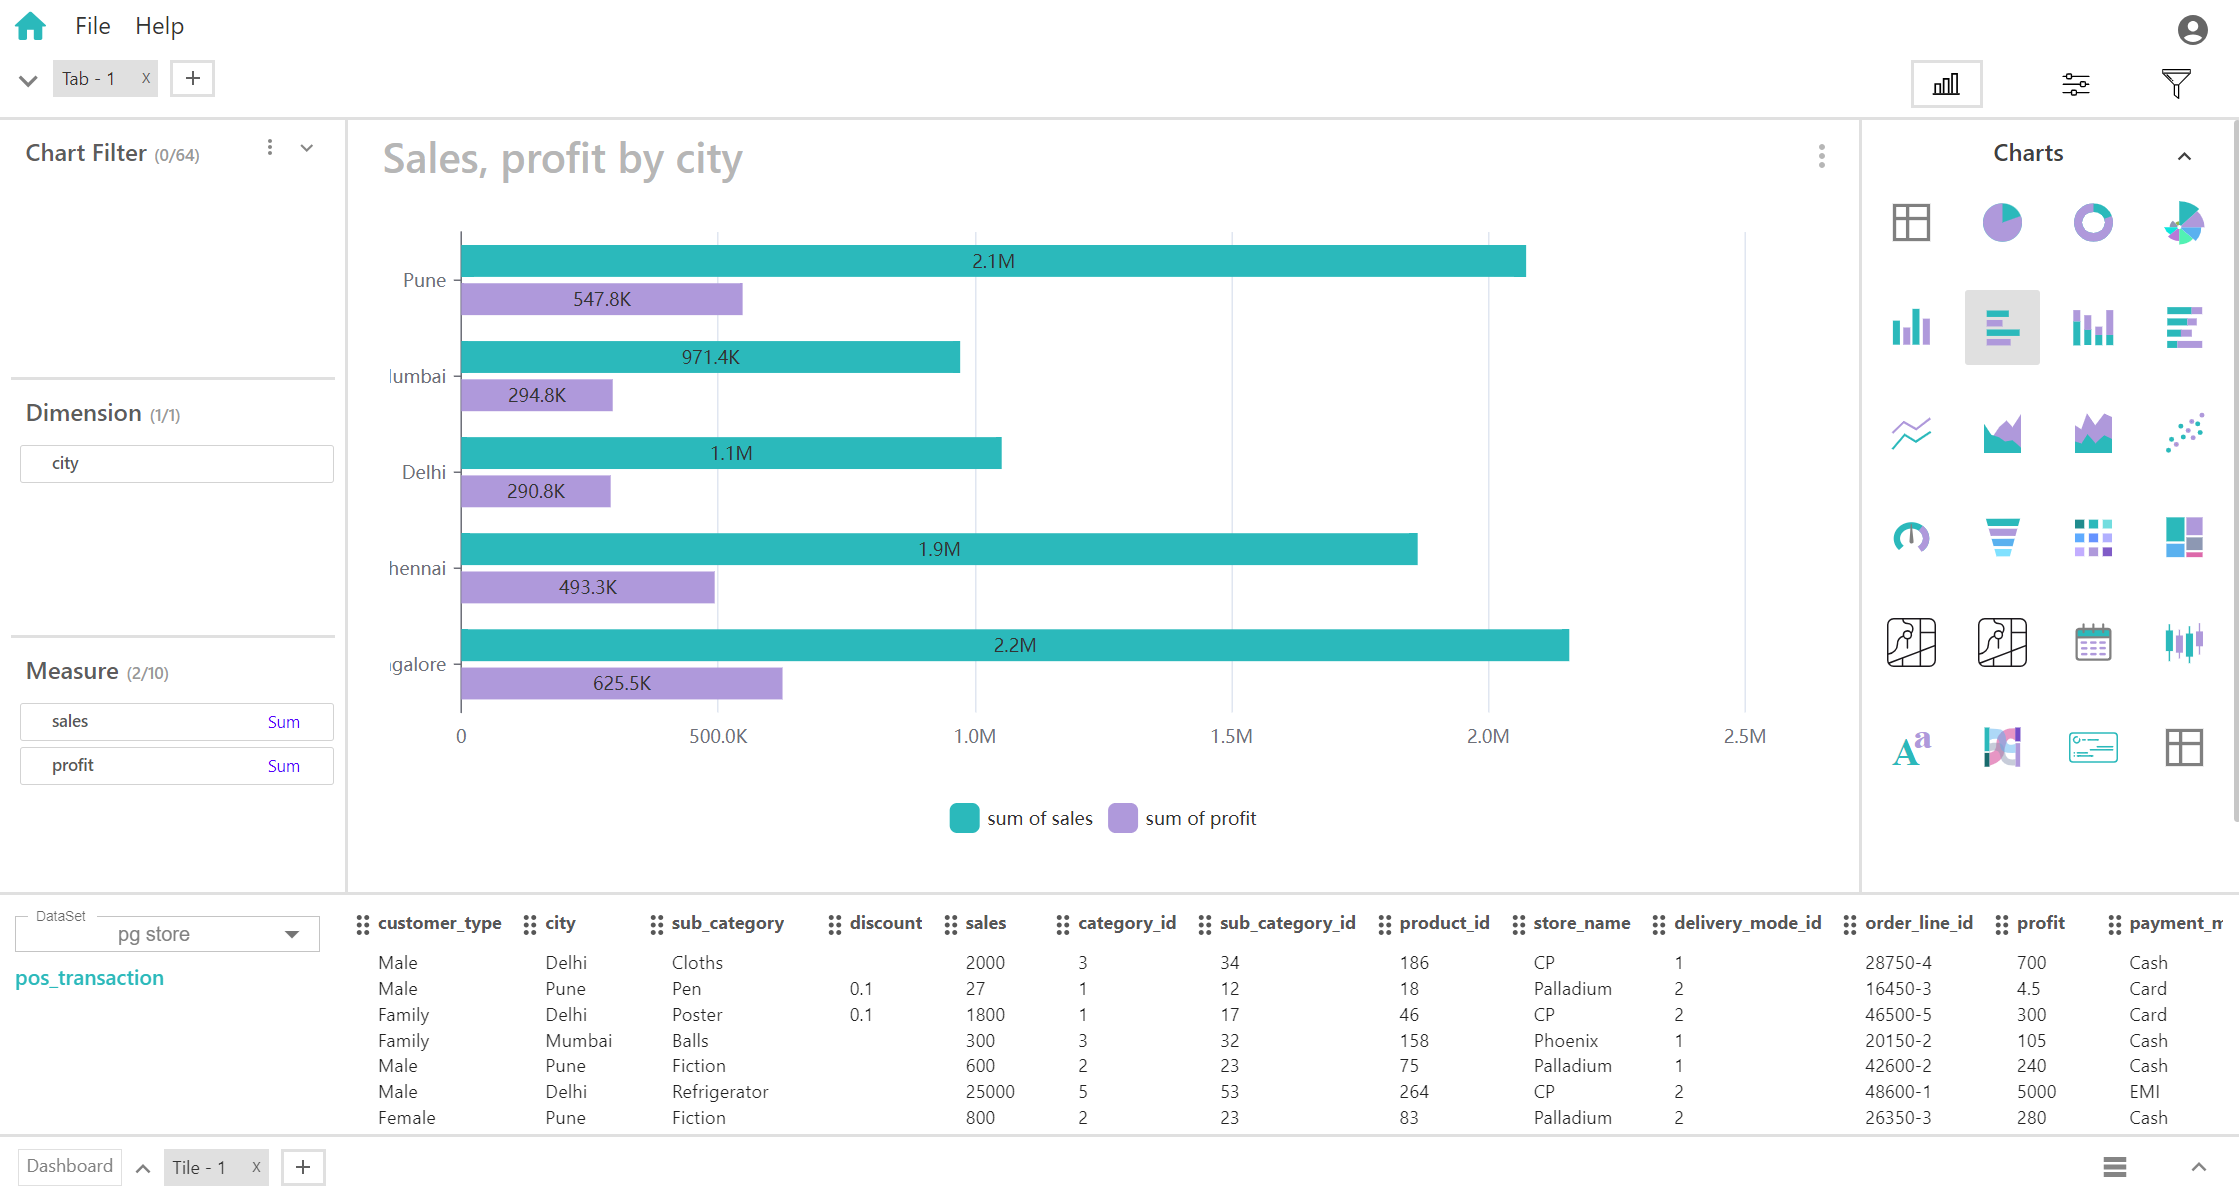
Horizontal Bar Chart
A horizontal bar chart is a type of bar chart where bars are oriented horizontally rather than vertically. When using a horizontal bar chart with one dimension and ten measures, the chart is designed to compare multiple metrics across a single category.
Key Fields of a Horizontal Bar Chart
- The single categorical variable that defines the groups or categories on the vertical axis. This dimension provides the context for the comparison.
- Categories such as different cities, regions, products, or time periods.
- Multiple numerical values associated with each category. Each measure represents a different aspect or metric and is displayed as a separate bar for each category.
- Various performance metrics such as sales revenue, profit, customer satisfaction, etc.
You can display a maximum of One Dimension and Ten measures in your chart/table.
When to Use a Horizontal Bar Chart:
- When the categories on the vertical axis have long labels, a horizontal bar chart provides more space for these labels, making them easier to read and reducing clutter.
- When you need to compare multiple measures (e.g., ten different metrics) for each category, horizontal bars allow each measure to be clearly displayed alongside the dimension, facilitating easier comparison across multiple metrics.
- Ideal for situations where the goal is to compare multiple metrics within each category. A horizontal bar chart makes it straightforward to compare the length of bars for different measures within each category, highlighting differences effectively.