 Signin


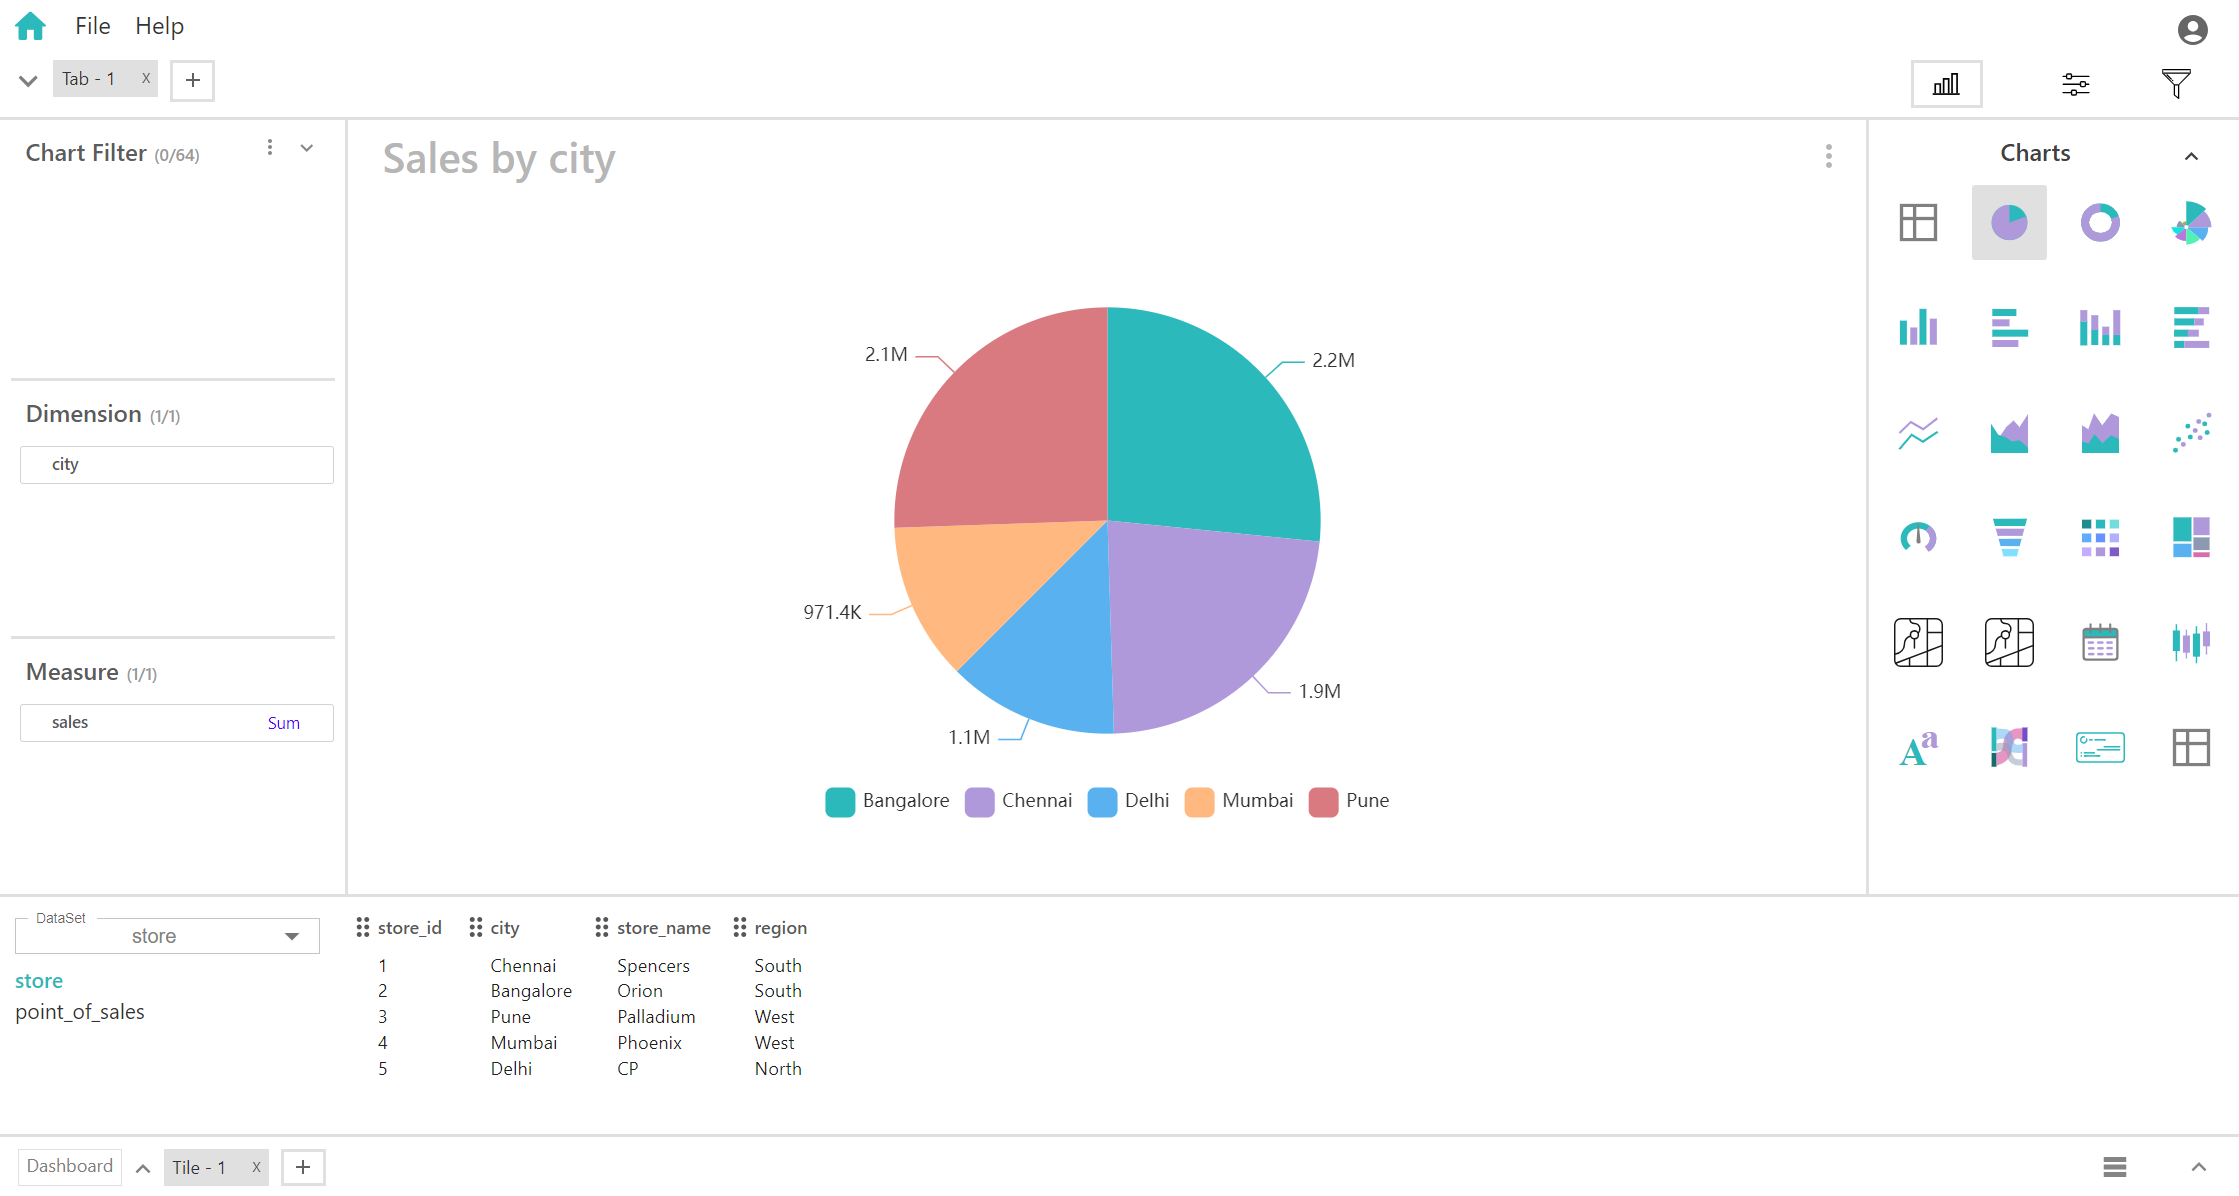
Pie Chart
A pie chart is a circular statistical graphic that is used to represent data in the form of "slices" of a pie. Each slice corresponds to a category's proportion or percentage of the total. The size of each slice is proportional to the value it represents, making it easy to compare the relative sizes of different categories at a glance.
Key Fields of a Pie Chart
- The dimension represents the categories or segments that the pie chart will divide into. It is qualitative and helps categorize the data.
- Geographical Dimensions: Country, state, city.
- This is the numerical value that determines the size of each slice. The measure reflects the proportion or percentage of the total that each dimension category represents.
- Sales Figures: Total sales, sales revenue.
You can display a maximum of One Dimension and One measure in your chart/table.
When to Use a Pie Chart:
- Pie charts are ideal for showing the relative proportions or percentages of a whole.
- Best used when you have a small number of categories (ideally fewer than 6-7) to avoid clutter and maintain clarity.
- Pie charts are effective for quickly conveying simple, straightforward data distributions.