 Signin


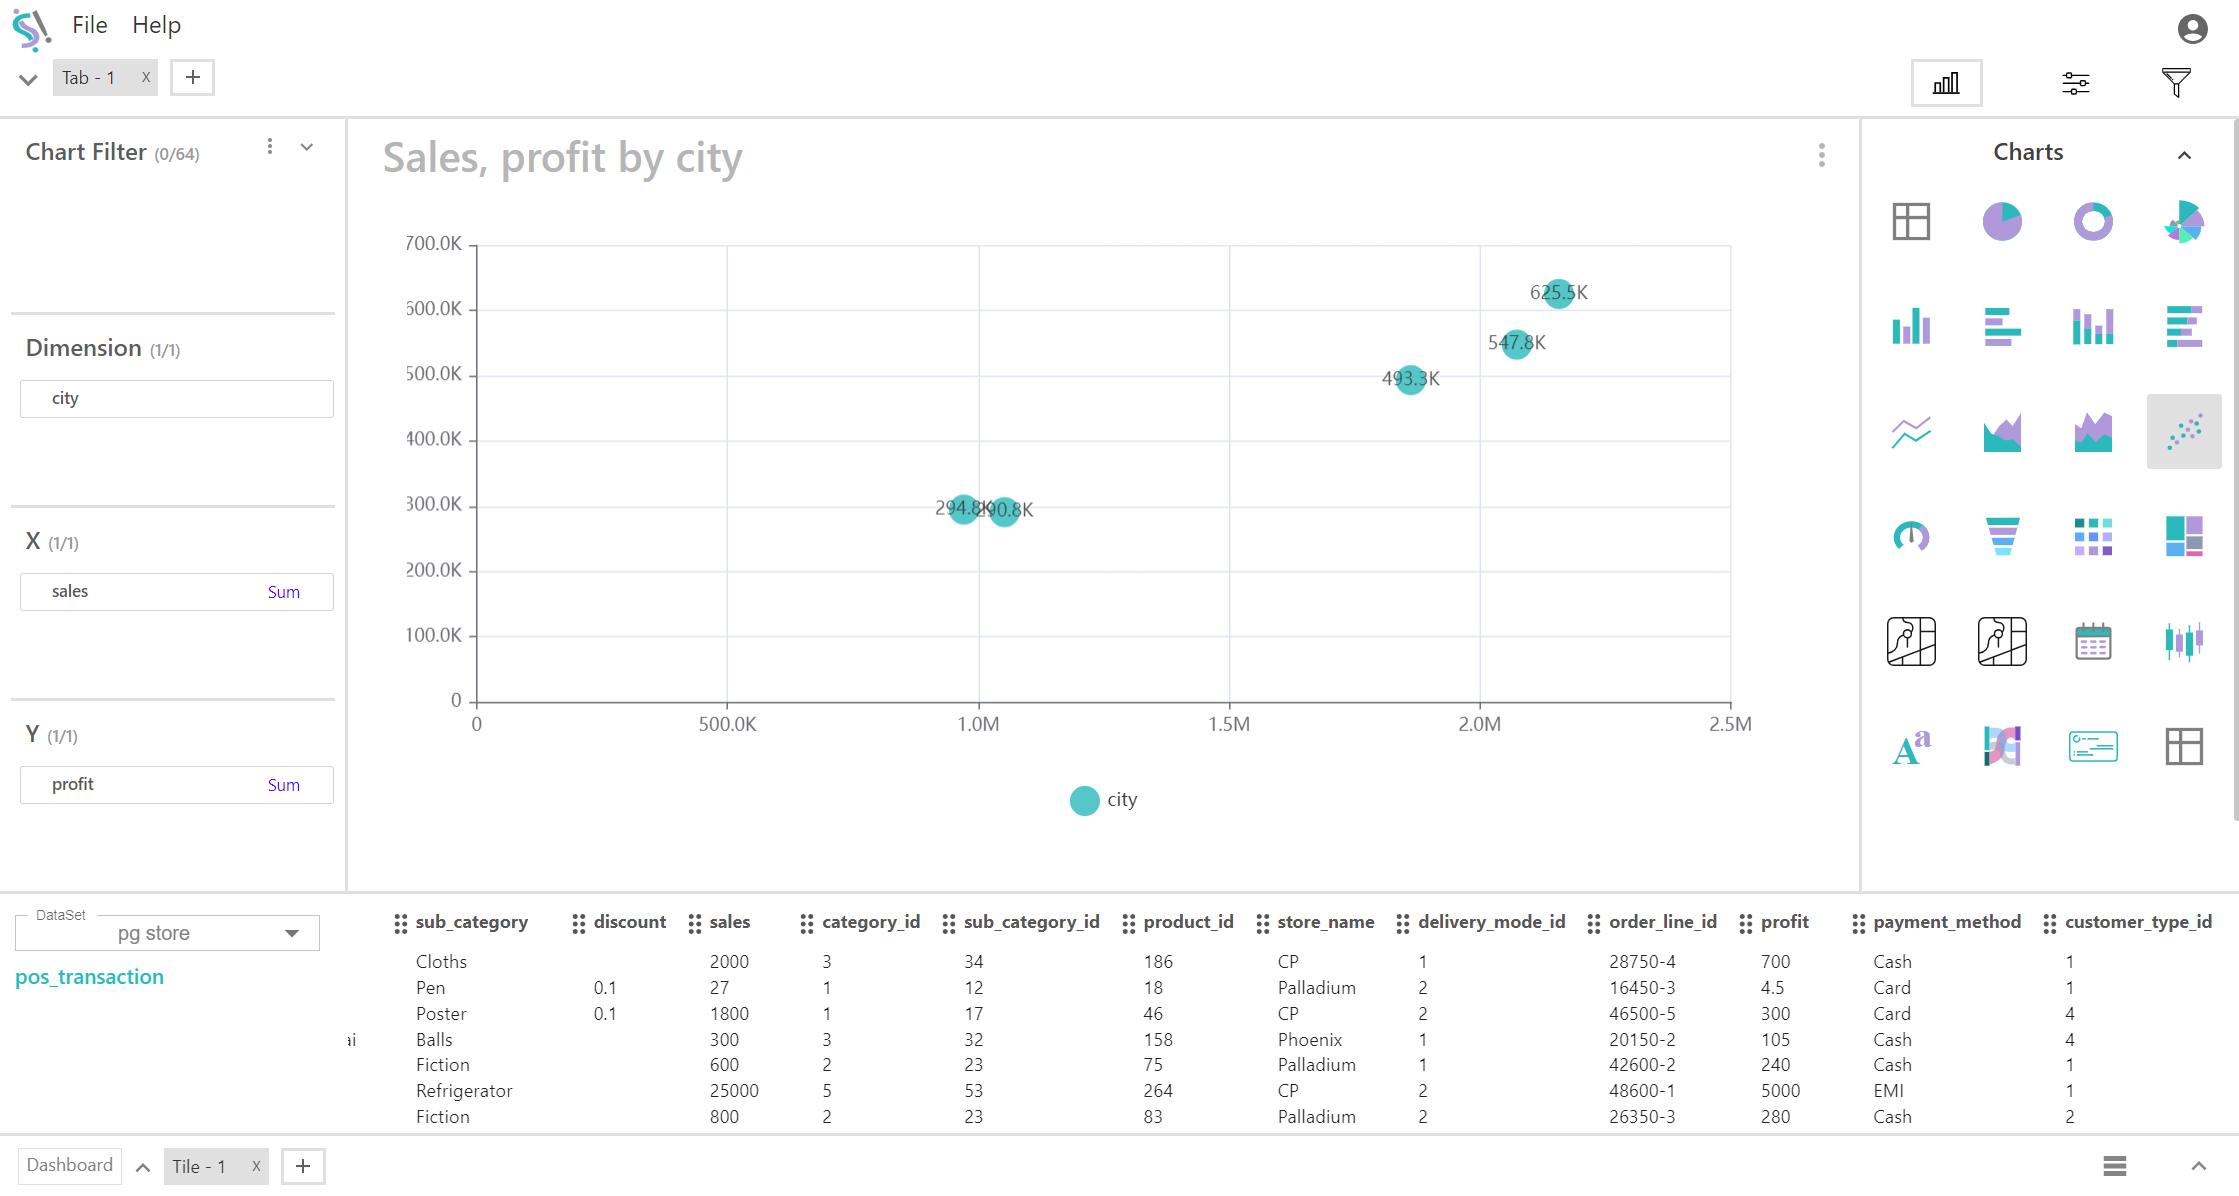
Scatter Plot
A scatter plot is a type of graph used to display values for two variables, represented by points on a Cartesian plane. It is useful for visualizing the relationship between two quantitative variables and identifying patterns, correlations, or trends.
Key Fields of a Scatter Plot
- Represents a categorical or continuous variable that serves as the context for the data points on the scatter plot. This dimension is not directly plotted on the X or Y axes but can be used to group or filter the data. Helps in understanding how the relationship between the X and Y variables changes across different segments or categories.
- Categories such as time periods (e.g., months, years), geographical regions, cities or different product types.
- Represents one of the quantitative variables and is plotted horizontally on the scatter plot. On the X-axis, this variable shows the values for which you are measuring the corresponding Y values. Helps in understanding how changes in this variable affect the corresponding Y values.
- Metrics such as time (e.g., days, months), temperature readings, or sales amounts.
- Represents the other quantitative variable and is plotted vertically on the scatter plot. On the Y-axis, this variable shows the values corresponding to the X-axis values. Helps in analyzing how this variable changes in relation to the X-axis values.
- Metrics such as revenue, performance scores, profit or measurements like temperature.
You can display a maximum of One Dimension, One X-Axis, and One Y-Axis in your chart/table.
When to Use a Scatter Plot:
- Ideal for examining the relationship or correlation between two quantitative variables. Helps in determining if there is a positive, negative, or no correlation.
- Useful for identifying trends, clusters, or outliers in the data. This can reveal patterns or anomalies that are not immediately obvious from other types of charts.
- When the dimension is used to group data, scatter plots can show how relationships between variables differ across categories or segments.